Last year, marketers were blessed with a juicy new metric: Share of Search.
Les Binet, Head of Effectiveness at adam&eveDDB, saw a need to create “a Share of Voice for the digital era.” When he unveiled Share of Search at the EffWorks Global 2020 Conference, it sparked a ton of interest in digital marketing circles.
It has a lot of uses — one of which is predicting market share. If Share of Search increases, market share tends to follow.
If the viral success of Share of Search has told us anything, it’s that marketers are hungry for new metrics that keep up with the digital marketing landscape. Share of Search helps us to zoom out and see how often our brands are searched online. But what if we want to zoom in and see exactly where our brands exist in search?
For that, we’ll need something different. But first, let’s look at the reasons why we need it.
Measuring Product Awareness vs. Product Distribution
While Share of Search tells us a lot about online consumer behavior, it only considers products / brands people ALREADY know about. But this leaves us with some pretty big questions. For example, how do we get people to know about our products / brands in the first place?
We’re talking about the difference between measuring product awareness vs. product distribution.
Twenty years ago if you needed something, you might drive to a physical store, walk down the aisle that had the products you were looking for, and look around. Maybe you were influenced by an advertisement you saw, or the recommendation of a colleague, perhaps even the sales agent.
However the most important indicator of sales velocity always comes from availability. Products that are located at the right place — at eye-level — in the aisle where you are looking for them.
Those were simpler times. These days, people get their product recommendations from the Internet at large. That means blog articles, review sites, and a whole slew of other places that customers reference during their buying journey.
This is the new customer journey. And brands need to focus on digital product distribution if they want to influence and win new customers who might not be aware of (or were not previously searching for) a brand.
Product Discovery in Search: How I Bought an iPad
In 2020, I bought an iPad Pro & Magic Keyboard combo — not based on a recommendation from any one person, but from many people.
And I didn’t know a single one of them.
My awareness of this product started with a blog article that I didn’t even ask for — it popped up in the newsfeed on my mobile phone.
It told me that Apple was creating a slick new keyboard for the iPad Pro. My curiosity was piqued and my journey towards purchasing an iPad Pro began.
From there I went to Google, found more articles, ended up on Reddit, and referenced a bunch of reviews from all over. My mind was inspired, my decision made — not from Apple’s website, but from content found on a series of third-party sites.
I did not set foot in an Apple store, and I did not communicate with any Apple employees.
One could argue that I was already brand-loyal to Apple. That certainly helped, but this was a new product extension to which I had zero exposure.
I had to first become aware that Apple was making a new keyboard just for the iPad Pro. Then I had to learn about the huge improvements to iPadOS. Finally, I had to learn about how app makers were hoping to capitalize on these innovations.
Every step of my customer journey — awareness, consideration, and purchase decision — was facilitated by 3rd-party sources.
If my attention wasn’t captured by that article in my newsfeed, my buying journey could have been very different.
I’m sure Apple pushed out a ton of ads, but in this case, I didn’t see those. I find it hard to believe Apple simply got lucky capturing a new customer like me. It’s far more likely that Apple is adapting its digital product distribution strategy to the changing consumer landscape.
For marketers, this is powerful stuff. No matter how well optimized your brand’s website may be, the modern customer journey is a winding road that often misses a brand owned website entirely.
So, should Apple give up trying to reach customers searching for “tablet laptop accessories?” Of course not.
Brands simply need to understand and actively manage what customers see on the digital product shelf, or page-1 of search.
Don’t Limit Brand Search Strategy to Only Your Website
As we’ve already pointed out, your brand doesn’t only exist on your website. It’s very likely reaching customers across all types of third-party sources:
Review sites (like BestProducts.com)
Media Coverage + News mentions (like Vox)
E-commerce sites (like Amazon)
Answers sites (like Quora)
Affiliate sites (like TripAdvisor)
Special SERP features (like Local Packs & Answer Boxes)
If you’re not convinced these sites matter, consider this: 82% of customers visit consumer review sites because they already have a purchase decision in mind. And 79% of people say that user-generated content highly impacts their purchasing decisions.
Local SEO platform BrightLocal did a survey that found 91% of consumers between the age of 18 to 34 trust reviews as much as personal recommendations. And while first-party reviews can help with your on-site conversions, most customers are looking to independent third-party reviews to confirm whether a product is worth buying or not.
For all the money brands spend on SEO (an estimated $79.27 billion in 2020), you have to wonder how much is being spent optimizing content off their websites.
If the goal is to have outstanding digital product distribution, brands need to invest in managing their presence everywhere their customers are searching for answers.
The Shopping Aisle Dilemma
When you think of how people used to make a purchase, the analogy of the shopping aisle comes to mind. Customers would recognize a need, visit a local store, walk down the appropriate aisle, and likely purchased whatever was best merchandised.
Simply put, Google is the largest and most important customer acquisition platform in the world. And brands have very limited real estate to reach the customer.
This is how we should be approaching modern product / brand distribution. Having your website rank is amazing, but it’s still just 1/10th of the range of options presented on the SERP and perhaps even less when considering your page position.
The onus is on brands to be as ubiquitous as possible in the new shopping aisle: your brand needs to be EVERYWHERE customers are clicking.
Search Behavior is More Predictable Than You Think
If your goal is to compete for customers who just started their buying journey (e.g. not yet decided on what they’re going to buy), there are ways to level the playing field. It’s all about patterns.
Luckily, click behavior in search is incredibly predictable. We KNOW where people click on average, when considering a mix of special SERP features, organic rank, etc.
At Visably, we reviewed millions of SERPs using click-stream data and have been able to map out the click-through-rate (CTR) of over 98% of Google SERP iterations. We use this data to understand what percent of a SERP’s audience any given brand is reaching.
For example, the first organic result, regardless of the keyword, receives an average of 30% of all the clicks when only organic results (no special SERP features) are present. When you review organic CTR data across millions of keywords month-over-month, as Advanced Web Ranking does, the data demonstrates in no uncertain terms that search behavior (where we click) has universal patterns.
This all boils down to the fact that brands have limited real estate to reach a customer. And that real estate is hyper competitive with sites that likely have a much higher Domain Authority than yours.
Take a search like organic lipstick for example. There’s not a single brand-owned website in the top ten! But there are plenty of products to browse in this digital shopping aisle. But even though their website’s aren’t present, cosmetic brands should actively manage what customers see here.
To do this, they’ll have manage how their brand is presented on 3rd-party sites that do rank.
The same goes for products with much longer customer journeys than cosmetic products. To illustrate this, Google produced a case study that found something very interesting — one woman had as many as 900 intent-driven microments in the 3-month period leading up to the purchase of her new car.
It is safe to assume that bigger purchases have more extensive customer journeys. But there are several companies with much smaller price tags who understand the importance of being everywhere their customers are online.
One brand that has been nailing this for a while: Hubspot.
Even though Hubspot ranks for many of their target keywords, they also know they need to have a larger digital presence than just their own website. So in addition to their own SEO efforts, Hubspot also focuses on having their product listed in high-trust affiliate sites, blogs, and review sites that reinforce their brand and improve the likelihood of an inbound demo request or sale.
Hubspot is so keen on the idea that they coined a new phrase to describe it: Surround Sound Strategy.
The idea is much like what we’ve been talking about here: if the goal is to be everywhere a customer is looking for answers, you can’t rely on your own website alone.
Share of Search vs. Search of Voice vs. Rank Tracking
So how do you know if your brand is reaching customers in the SERP? Traditional marketing metrics aren’t much help.
Share of Search Share of Search falls short of what we need because it only considers branded searches (e.g. product awareness). It doesn’t measure brand strength WITHIN the SERP, which requires analysis of individual search results. And what do you do when there is no trend data to draw from, as is the case with new product and brand launches?
Share of Voice What about our old friend Share of Voice (SoV)? Share of Voice helps us understand how frequently a brand is mentioned in comparison to all relevant competitors. In recent years, it’s been used to track online media mentions, PPC, and website traffic for example.
And while determining your SoV can be useful, there’s one major problem when we use it for search: SoV doesn’t account for the fact that clicks aren’t equally distributed in the search results page.
In other words, SoV has no correlation to how many people you’re reaching in the SERP.
For example, an SoV of 50% with organic SERP content sounds outstanding. But consider that the difference in CTR among the bottom 50% of search results verses the top 50%; there’s no way of telling how well you’re really doing.
Rank Tracking What about standard Rank Tracking metrics? Sure, they can tell us where our website exists in search. But rank tracking doesn’t tell us where your brand exists or how well you are influencing the customer journey.
And that turns out to be a huge problem because Brand Owned content is at a fundamental disadvantage when trying to reach larger audiences and more popular keywords.
Why? Because Brand Owned sites, on average, have a significantly lower Domain Authority than Ecommerce and Earned Media websites — and hence will always lose out on top search positions when an Earned Media or Ecommerce website is targeting the same keyword. To illustrate this, we compared the Domain Authority of 1000 Earned Media sites, 1000 Ecommerce sites, and 1000 Brand Owned sites:
What SEO Does Well (Website Tracking), and Where it Fails (Brand Tracking)
To hammer home the importance of third-party sites when developing search strategy, let’s look at another example of keyword / brand exposure conflict with the search phrase “Ski Pants.”
With a monthly search volume of 40,500, there’s a ton of qualified customers up for grabs. Not only that, but this keyword has a cost-per-click (CPC) of $1.35, indicating that people searching this term have a reasonably high purchase intent.
So if your brand sells ski pants, this is a fantastic place to reach customers. But here’s the thing: virtually all the results are 3rd-party sites.
Google’s not giving brands any prime real estate here.
Now take a brand like Patagonia, a leading manufacturer of ski pants. Patagonia.com doesn’t rank on the first page for this keyword.
However, if you look a little deeper at the organic PAGE CONTENT that does rank within the SERP, you can see that Patagonia is well represented. A customer looking for ski pants is going to find Patagonia most places they click within the SERP, or — in other words — Patagonia is reaching their target customer by having excellent product distribution within the SERP among ecommerce partners and well-placed PR.
Introducing “Share of Click” (SoC)
That was a lot of build-up, but we wanted to make it clear: brands need an integrated approach toward search strategy. It’s not enough to optimize your brand website for search. You have to optimize your BRAND for search.
Allow us to introduce a new measurement methodology: Share of Click (SoC).
The core reason we developed Share of Click is to answer a simple question: Where does your brand exist in the SERP? And perhaps more importantly, how many people saw it?
Share of Click is an ideal key performance indicator of brand distribution within the SERP and directly relates to how much of the SERP’s total audience a brand is reaching.
In other words, Share of Click is a single metric that measures your brand’s total coverage in the SERP.
DEFINITION: Share of Click
A measure of a keyword’s audience exposed to a particular product or brand. Share of Click = (number of clicks received by organic results that include “x” brand or product) / ( total clicks received by all organic results in a SERP).
(n.b. At Visably, we do not include paid media or shopping results in an SoC calculation.)
Share of Click recognizes that each organic result has a unique CTR and pairs that knowledge with brand analysis of the result’s page content. SoC is a form of brand-listening applied to the SERP that also blends search volume metrics, organic CTR, and CPC information.
At Visably, our vision is to fundamentally change how marketers approach search engine strategy. We review everything a customer sees and we use that data to help brands align search marketing efforts, recognize and fix blind spots, and become brand-dominant across all channels that display in search results.
Stay with us as we dive deeper into Share of Click and how to increase your brand distribution in search.
AUTHORS
Chris Dickey Chris is the Founder and CEO of Visably and the creator of Share of Click. Chris lives in Jackson Hole, WY and also operates a brand communications agency. LinkedIn
Ryan Cordoni Ryan is a marketer & content creator whose work has spanned several industries, including tech, software, and ecommerce. When he’s not writing, you’ll find his listening to podcasts and making weird electronic music. Ryan lives in British Columbia.
While there are plenty of SEO tools available, the four most popular in the industry are Moz, SEMrush, Ahrefs, and Spyfu.
Whether you’re running SEO for an enterprise-level business or improving a personal blog, finding the right tool can make a huge difference in your SEO strategy and overall site health.
Therefore, this post dives into key features, differences, and similarities of each tool to help you select the perfect solution for your business.
Specifically, I’ll examine their merits in these categories:
Let’s begin by determining which tool is best for researching your keywords.
To compare the tools, I started with an analysis of each tool’s keyword volume estimates.
I checked the monthly search volume of 150 keywords across Google Adwords and all four tools and averaged them together to get a holistic view of the difference in estimates.
As you can see, among the four tools, Moz, Spyfu, and Ahrefs all have very similar averages, while SEMrush is a higher outlier.
These differences have to do with the methodologies they use to calculate their search volume. SEMrush uses an algorithm, while the rest use combinations of Google Adwords and clickstream data.
Unfortunately, gathering 100% accurate data is pretty much impossible.
For example, take a look at the data from Google Adwords, which you might expect to have the most accurate data. The average volume of these 150 keywords was 72,729—over 50,000 higher than SEMrush.
The discrepancies occur for a variety of reasons. For example, Google Adwords uses a rounded annual average. Therefore, a keyword like “Valentines Day gifts” might show a monthly volume of 1200, though the distribution might be closer to 1,000 in February and the other 200 spread out between March through January.
In addition, Google Adwords conflates keywords together. Therefore, if you have two synonyms like “NFL” and “National Football League,” Adwords might show you the same search volume for the two combined.
However, each tool differs in both how it calculates data and the frequency in which they update their search volume data.
We get a slightly different view when we look at median keyword volumes across the 150 keywords.
While still being a high-volume standout in comparison to the tools, Google’s median keyword volume is closer to the other tools. The few keywords that were clearly made of several combined keyword volumes have less of an impact.
Moz again has the lowest numbers, which when examining the data, happens because Moz shows a lot of keyword volume estimates as 5 searches per month, which brought the median down considerably.
Interestingly here, Spyfu has the highest median keyword volume compared to the other tools, rather than SEMrush, which means it had more total keywords on the higher side and fewer on the lower side.
With that out of the way, let’s get to the features.
Moz
Their Keyword Explorer tool includes four main features:
Keyword Overview
Keyword Suggestions
SERP Analysis
Put in your keyword, and the Keyword Overview provides a simple at-a-glance view of its Monthly Search Volume, Keyword Difficulty, and Organic CTR.
Image via Moz
A high Keyword Priority score (100) means that the keyword has a high organic CTR and volume, yet a low difficulty. Therefore, it should be a priority to rank for. However, a low Keyword Priority score means that you have a low organic CTR/volume and high difficulty.
If you click on “Keyword Suggestions,” you can find similar keywords and sort by a variety of different factors including volume, group keywords, and the type of keyword suggestion (for example, keywords based on similar topics vs keywords that contain your identical keyword).
Image via Moz
You can also get a closer look at the keyword’s SERP with Keyword Explorer’s SERP analysis.
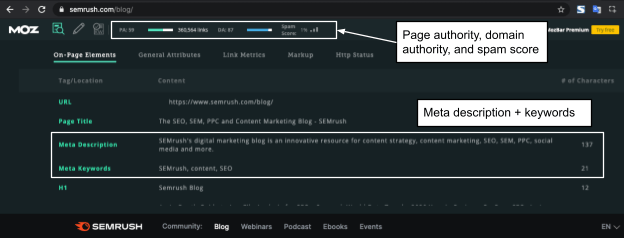
This is helpful to get a quick overview of the SERP competition, with metrics like Page Authority, Domain Authority, Page and Root Domain Backlinks, and an overall Page Score for each.
Therefore, if you’re considering writing a post for a certain keyword, you’ll know whether or not you’ll have a shot at ranking for it based on the links that the top posts have.
Image via Moz
Pros:
The “Display keyword suggestions that” option allows you to pull up a list of broadly related keywords for more keyword ideas than most other tools
The priority feature and simple interface make it beginner-friendly
Cons:
Doesn’t provide metrics for SERP features, or even show the results in “Related Questions” or “People Also Ask.”
Excludes key metrics like organic click percentages, a visual breakdown of traffic geography (US, Canada, etc)
No PPC data
SEMrush
SEMrush’s keyword research tool is similar to Moz, but includes some extra metrics, which we’ll go over here.
Within its Keyword Research tool, SEMrush also offers:
Keyword Magic Tool
Keyword Manager
Organic Traffic Insights
The Keyword Overview provides a detailed report on the keyword of your choosing.
mage via SEMrush
It goes a little bit deeper than Moz by including:
CPC value
Global volume broken down by country
Total number of URLs in the SERP
Types of SERP features.
SEMrush also shows a PPC competition metric next to the CPC price. This gives you an idea of the competition level between advertisers over this keyword, on a scale of 0 to 1.0. A Score of 1.00 shown here means “Backcountry Skis” is extremely competitive.
Image via SEMrush
You also get keyword variations, related keywords, and questions, which can be helpful for finding long-tail keywords.
SEMrush’s Keyword Magic Tool can help you search for keywords to target, whether for SEO or PPC.
This tool is super filterable and sortable by Keyword Difficulty, CPC, Competitive Density, SERP Features, and results, making it easy to find the right keywords for your SEO campaign.
mage via SEMrush
Another cool feature on the left lets you look at keyword clusters—or keywords that often occur together. This is great for finding other relevant keywords to include in your post.
Pros:
Useful for those who also run PPC campaigns
Offers the most keyword features, along with Ahrefs
Cons:
It can be difficult to get the hang of, especially for beginners
Its user interface is a little overwhelming and not very clean
Spyfu
The sheer amount of metrics that Spyfu offers in its Keyword Research tool is impressive, including Advertiser History, Ranking History, Backlinks, SERP analysis, and a helpful Google Ads Advisor for PPC research.
Let’s dive into it.
The Keyword Overview page includes all of these tools mentioned above as modules, and you can also click on the tabs at the top to get greater detail for each.
You’ll see an overview of standard metrics like monthly volume, keyword difficulty, and CPC for each keyword.
However, it also shows some more unique and useful metrics like estimated clicks and “Clicked any result,” which shows the proportion of users that click on something. For example, you may find that some SERPs have a featured snippet that answers the user’s question and results in a no-click search.
You can also see the proportion of people who click on ads and whether they tend to search for this keyword on mobile or desktop, which can help tailor your PPC strategies.
Image via Spyfu
You can also see a variety of ways to browse new potential keywords, including questions for long-tail keywords and “Also buys ads for” to see what other keywords companies are spending money on in PPC.
Advertiser History quickly tells you who your top advertising competitors are and estimates their ad spend and coverage.
Image via Spyfu
Organic RankingHistory provides a graph of the changes in rank of the results in the SERP over time.
Image via Spyfu
I like how it points out when Google implements algorithm changes, giving you a sense of the difference those changes make on you and your competitors’ progress.
Like the SERP analysis offered by Moz, Spyfu’s SERP Analysis goes a bit deeper, providing rankings for the first 6 pages of the SERPs. SERP features, however, are not included.
Image via Spyfu
In addition, they also recently came out with a competitive analysis keyword research tool that makes it easy to see what the most valuable keywords for your competitors are and sort those keywords by difficulty, topic, and much more.
Pros:
One of the most in-depth competitor keyword analysis tools, enabling you to track competition’s most valuable keywords and gains and losses.
The only tool that allows you to view historical rankings for up to five years for free
Extensive PPC information with an Also Buys Ads section and even makes recommendations for other great PPC keywords
Cons:
It doesn’t offer search volumes based on countries
Their keyword database is still growing, so much of the data it shows is only relative to other keywords in their database
Ahrefs
Ahref’s keyword research tool also offers a lot of data when it comes to their Keyword Explorer.
On the Keyword Overview page, you get Keyword Difficulty, Search volume, and CPC value as well as estimated clicks and volume by country.
The percentage of paid vs organic clicks over time is particularly interesting, as you can get a sense of what types of links are driving clicks in this SERP.
Image via Ahrefs
One thing I should note is that the keyword difficulty that Ahrefs shows for “backcountry skis” is radically different from the other tools, which ranged between 37 (Moz) and 82 (Spyfu).
The reason that Ahrefs differs so greatly is because of the way they calculate it. Ahrefs takes fewer variables into account when determining the score, which leads to a less nuanced view of a keyword’s difficulty.
There’s also a variety of ways to get new keyword ideas related to your topic:
Phrase match
Having same terms
Also rank for
Also talk about
Search suggestions
Newly discovered
Questions
For example, if we look into People Also Talk About, it shows the keywords and phrases that the top 100 ranking pages for your target keyword frequently mention.
Image via Ahrefs
Along with normal metrics, it tells you when it was updated (which is very often) and lets you look at the SERP overview as well as position history for each keyword.
Image via Ahrefs
Ahref’s keyword research tool also includes a nifty Ads History tool, which you can sort by domain and landing page to see who has been spending the most money on this keyword over time.
Image via Ahrefs
If you’re planning to run a PPC campaign, this helps you get a quick lay of the land and understand who your main competitors would be for different keywords.
Pros:
One of the most extensive keyword research tools with a large database
Easy user interface
Cons:
Their keyword volumes tend to range quite a bit compared to other tools
Not very good at showing other related keywords (for example, if you search for “pants,” it won’t show other keywords like “jeans.”
Comparing Backlink Analysis Tools
Let’s begin our analysis of backlink tools by comparing the respective platforms’ link index size. To do this, we’ll use a domain from the popular Outside Magazine, www.outsideonline.com.
Here’s what we get when we put this domain into each backlink index tool.
The first thing you’ll notice is that we don’t have data for Spyfu. The reason is that Spyfu only looks at backlinks that are in the first 50 pages of search results, so it can’t provide a full picture.
Moz has been able to detect the most linking domains, which are more straightforward to compare and more important than inbound links for ranking keywords.
SEMrush has detected the most inbound links by far, beating out Ahrefs in inbound links by 6.5 million. However, it’s important to note that each tool’s methodology impacts the results for inbound links and ranking keywords, so these aren’t great comparisons.
You’ll also notice that the number of linking domains are all very similar, with SEMrush Moz, SEMrush, and Ahrefs showing index sizes within a few thousand. SEMrush and Ahrefs are within less than 100.
Let’s dig into the features.
Moz
Moz’s Link Overview tool, Link Explorer, gives you a nice topline view of the types of metrics you would expect from a backlink analysis tool: Domain Authority, Linking Domains, Inbound Links, and Ranking Keywords.
Image via Moz
If you’re doing competitive research, you can easily download the links you need without having to do much digging.
You also can see the number of links that have changed over the last two months at a glance.
Image via Moz
For Inbound Links, Linking Domains, and Top Pages, there are individual pages that you can use to filter and sort by Domain Authority, the number linking domains, and Spam Score.
Image via Moz
You can also view anchor texts to see whether links tend to be branded (include the brand name) or generic (click here, etc.).
Image via Moz
Pros:
A recent study shows Moz does indeed have the largest link data set
Only tool that shows a spam score while scrolling through backlinks
Cons:
Downloading reports can be slow
Offers fewer features than SEMrush and Ahrefs
SEMrush
Like its keyword research tool, SEMrush shows a ton of information on its Backlink Analytics tool overview.
At the top, you can see the Domain Authority, Referring Domains, Number of Backlinks, Monthly site visits, and keywords. This is similar to Moz’s topline backlink metrics, with the addition of monthly visits.
Image via SEMrush
The UI for adding competitors for comparison is easy to use and even suggests competitors without you needing to do any research.
Image via SEMrush
The domains that come out on top are clearly highlighted.
If you move over to the Referring Domains tab, it shows you the types of websites that link to your domain, as well as where the majority come from.
Image via SEMrush
Plus which domains provide the most backlinks.
Image via SEMrush
Pros:
The only tool that shows an overview of other websites with similar backlink profiles to give you an idea of what other links you can target
Breaks down links by category type (arts & entertainment, travel, etc) which can be useful when presenting to clients
Overall dashboard is easy to navigate
Cons:
It may take a few more clicks to get to what you’re looking for, but overall quite effective
Spyfu
Spyfu’s Backlinks tool automatically surfaces the highest performing backlinks for a keyword.
A useful feature is Backlink Kombat, which can help you find backlinks to your competitor’s domain that you’re missing.
mage via Spyfu
However, I found this tool slightly frustrating because I couldn’t put in a domain and get information like the number of Linking Domains and Inbound Links.
Again, they don’t offer these metrics because Spyfu only ranks backlinks that rank in the top 50 organic search results.
Pros:
I like that it allows you to sort each backlink by the kind of website (blog, news, forums, etc)
Backlink Kombat makes it easy to see links your competitors have that you’re missing
Cons:
It’s overall underdeveloped as it’s purely used for competitor analysis and doesn’t hold its own as a standalone backlink tool
Ahrefs
Of all of the backlink tools we’ve analyzed, Ahrefs’ Site Explorer had the most to offer in terms of data.
Take a look at just the top half of the overview page. Jam-packed, yet still an easy user interface.
Image via Ahrefs
This shows not just the domain rating, but also URL rating, which assesses the strength of an individual page and takes intra-domain and nofollow links into account.
You can see your total backlink domains and referring pages over time, as well as your target keyword’s overall rank according to Ahrefs.
Another handy metric that it provides is the traffic value, which estimates the total value of organic clicks if you were to pay for them. This is especially important to estimate the value you receive from ranking in this SERP organically.
And with Ahrefs’ frequent crawls, you can keep tabs on new backlinks and reevaluate your strategy on the fly. This spotted new ones in minutes.
Image via Ahrefs
Ahrefs’ backlink tool also gives you a variety of ways to look at how individual pages within your domain are performing in terms of backlinks. Here’s Top Pages.
Image via Ahrefs
Use this to identify and build more content around your highest performing pages.
And you can look at the pages with the most growth to see what’s hot right now.
Image via Ahrefs
Finally, Competing Domains allows you to see your top competing domains and how much your keywords intersect. Cool!
mage via Ahrefs
The link intersect feature also makes it easy to see which domains link to your competitors but not to you.
Pros:
Ahrefs is virtually tied with SEMrush for the most features, though it has an easy user interface with clear graphs that makes it easy to use during pitches and presentations.
Cons:
It’s really an excellent tool for all of your keyword research needs.
Comparing Technical SEO Tools/Site Audit
A website audit tool is crucial for making sure your website performs well in search. It can help you uncover errors and ensure your website is more crawlable for Google.
Let’s take a look at what these tools offer.
Moz
Moz has an On-Demand Crawl tool that shows you topline issues but doesn’t go super deep in its analysis.
You can see the total pages within the domain crawled, as well as critical crawler issues, which it labels as the most important.
You also get Crawler Warnings—a step down from critical—Metadata Issues, Redirect Issues, and Content issues.
Image via Moz
All of the pages crawled are searchable and filterable farther down, with metrics like Page Authority and Crawl Depth.
Image via Moz
Moz also has an On-Page Grader tool, but the information it returns is pretty sparse in comparison.
Image via Moz
At the bottom, there are dropdowns to explain the different factors affecting your page, which is helpful for learning about factors that affect score, but it seems slightly disconnected because it lacks specifics for your site.
Image via Moz
Pros:
It makes it easy to find basic issues like status code errors, crawl depth, meta/title description length, and more
Cons:
It could be more specific about why page score is what it is and what your website specifically could do to improve it
SEMrush
In the Site Audit tool, SEMrush breaks down your issues into 3 categories depending on urgency.
The biggest problems are bucketed as Errors, then you also get Warnings and Notices.
Image via SEMrush
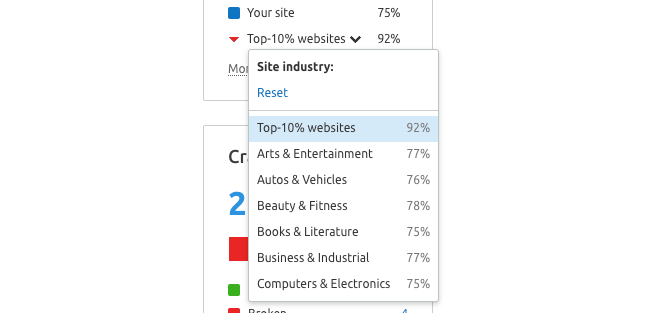
You also get an assessment of overall site health, including benchmarks for websites in different categories like Arts & Entertainment and Autos & Vehicles to compare against your website.
Image via SEMrush
With the statistics tab, get a closer look at several metrics like crawl depth, which helps you understand your site’s architecture. It’s not as robust as Ahref’s structure explorer (which I’ll cover below), but it can get the job done.
Image via SEMrush
Flip the toggle at the top back and forth to see in graph or list form.
Digging into the details for internal links, there’s a link distribution module. This is great as it can show you which pages are strong and not linking to any weaker pages and which weaker pages could use links from stronger pages.
mage via SEMrush
Pros:
Quite robust with thorough data including page markup, status codes, AMP links, internal links, canonicalization, and more.
The internal link feature is quite useful as you can use it to ensure you’re sending links from high performing pages to weaker performing pages.
It gives you an organized list of what to work on first.
Cons:
Overall, it has a really great site audit tool, though it limits the number of sites you can enter.
Spyfu
Spyfu doesn’t offer a site audit tool. To do this while using Spyfu, you’ll need to use one of these other platforms.
SEMrush allows you to do a site audit for 1 site with 100 pages on their free version, so I would recommend that for beginners. However, if you need to do audits on multiple sites, you’ll need to pay.
Ahrefs
Ahref’s Site Audit tool has a lot to offer in terms of different metrics and ways to analyze your site.
It has a health score front and center, which tells you right away whether it needs a lot of work or not. It’s also good for establishing a baseline to improve upon if you’re just getting started.
Image via Ahrefs
There’s also a Top Issues module on the overview, which helps you narrow down where to start your work. I only did one crawl, but if you continue your crawls, this will update to keep you abreast of changes to issues with your site.
Image via Ahrefs
A cool feature that I like is Link Opportunities. This tool shows you all the places where you might want to add a link. Good, plentiful internal links help search engines to better understand your site and spread page authority.
Image via Ahrefs
Another cool feature is the Structure Explorer. This tool analyzes your site’s architecture to ensure that your site is relatively flat, so that getting anywhere from the homepage requires fewer clicks. This will help with ranking as well as make the user experience better.
Image via Ahrefs
There are also a variety of different reports:
Internal Pages
Indexability
Links
Redirects
On-Page
Social Tags
Duplicate Content
Localization
For example, this is the Links report.
Image via Ahrefs
Right away you can see all the broken links you need to fix and the distribution of internal to external links.
Overall, I’d say the best tool for a site audit is Ahrefs. There’s a ton of information there, and the UI is better than the competitors.
Pros:
Provides an easy user interface with all the information you need in one dashboard
For each error, they offer an explanation on why it’s an issue and how to solve it
The only tool that offers a visual site architecture map
Cons:
Overall, it’s a great tool and probably the best for technical SEO
Comparing Rank Tracking
Now, let’s take a look at the difference in rank tracking capabilities between the two platforms.
Because I’m just testing these products out for however long the trials last, you’ll notice that there isn’t a ton of historical data on each keyword. However, what they CAN do is most important, and that’s what I’ll show.
Moz
To see how your site is performing for a certain keyword, simply input the keyword and URL at the top of the page, and it will be added to the list at the bottom.
It provides metrics like rank, which maxes out at 51+. To be fair, your page is irrelevant if it’s that far down, but it would still be helpful to know the exact rank.
Image via Moz
It also provides keyword volume and difficulty and tells you the last time it was updated. In Moz’s case, this takes place once a week.
But that’s everything. It doesn’t go deeper or provides graphs, just those few metrics on a weekly basis.
You could perhaps export these metrics and create a graph that way, but most other ranking tracking tools in this review do that automatically.
SEMrush
SEMrush’s Position Tracking tool, like its other tools I’ve covered, provides a lot of metrics for measuring your standing in the SERP.
At the top of the landscape tab, we get visibility, estimated traffic, and average position.
mage via SEMrush
Visibility is an interesting metric—it shows the percentage of clicks within tracked keywords that land on your website. Our own Visably Score is similar in that it also calculates “share of click,” but we look at whether your brand is mentioned in all results—not just your website.
Ahref’s version of Visibility is also helpful to determine where you stand in the SERPs.
Estimated Traffic is similarly interesting—it takes into account keyword traffic and your position in the SERP to estimate the probability that someone will click on your domain.
There are graphs to show you the distribution of your rankings, which is a good top-down view of how you’re performing in your keywords.
Image via SEMrush
I particularly like their Competition Map in the Competitors Discover tab. You can easily see who your top competitors are and the size of their impact on the SERP relative to you. Below, it lists out their Visibility in comparison, Estimated Traffic, and Average Position.
Image via SEMrush
I found the Featured Snippets tab useful as well, which breaks down snippets into “Already Featured” and “Opportunities” should landing in featured snippets be one of your SEO goals.
mage via SEMrush
Pros:
It does precisely what a rank tracker should do and updates frequently (every few days)
It also has plenty of graphs and visual elements that make it easy to see how far off you are from certain competitors which can be helpful for identifying long term competitors and smaller immediate competitors
SEMrush sensor also allows you to monitor keyword volatility
Cons:
None apparent
Spyfu
I found Spyfu’s Rank Tracking tool to be easy to use thanks to their simple UI, and it includes some helpful metrics and graphs.
First, let’s look at the Keyword Universefeature. If you’re just getting started with rank tracking, this automatically lists and tracks all the relevant keywords for your domain.
No need to start with keyword research if you want to see how you rank—this is a great way to view your standing in the wider universe of keywords. It’s pretty exhaustive, too. Almost 37,000 keywords are included right away.
Image via Spyfu
As you can see, it provides CPC, Monthly Searches, and Estimated Clicks, as well as your change in rank for these keywords.
Once you’ve put a bit more effort into keyword and competitor research, you’ll probably have a more targeted set of keywords to focus on.
Add those to groups for your specific needs, and you get a nice dashboard to analyze your performance.
mage via Spyfu
If you click on any of the metrics in the dashboard, you’ll get a graph showing their progress over time.
Some nice topline metrics here include the total number of ranks where you’re improving or losing steam, as well as some estimates for how many clicks your site is getting in the keyword group.
Spyfu also auto-populates some other groups, like “Easy Wins” and “Biggest Traffic Opportunities,” which you can incorporate into your own keyword strategy.
Pros:
Automatically enters your top ranking keywords
An overall quality tool with rank tracking of up to one year
Biggest Traffic Opportunities gives you actionable data to implement in your SEO strategy
Cons:
The data is only updated weekly, so if you need something more often, you might want to consider a different tool
Ahrefs
Ahrefs’s Rank Tracker tool can get really granular and includes some unique features.
On the Overview page, there are tabs for Visibility, Average position, and SERP features, which allow you to dig into the details.
Image via Ahrefs
Depending on your plan, these update every 3, 5, or 7 days.
Another useful feature is the ability to rank position filter. For example, if you want to focus your efforts on improving only keywords you rank below position 3, you can exclude keywords that rank at or above position 3.
Image via Ahrefs
There’s also really good competitor ranking analytics, where all the same metrics are applied against your competitors over time.
Image via Ahrefs
Pros:
Easily track keywords with all basic features and some advanced features
A granular view of each keyword complete with graphs, SERP analysis, and more
Sort keywords by position, declined, and improved
Cons:
None apparent
Other Unique Features
Here are some tools and features that aren’t their bread and butter, but are interesting and/or helpful for certain tasks.
Moz
Moz has a cool extension for chrome that’s free (well, all it costs is your browsing data) called MozBar.
When you add it to your Chrome browser, it allows you to get some quick metrics for whatever page you’re viewing.
Image via Moz
At a glance, you can view that page’s Domain Authority, Page Authority, and Spam Score.
You can also use it to highlight any links on the page, whether they’re internal or external, and follow or nofollow.
Here’s what the page looks like when I highlight all follow links.
Image via SEMrush/Moz
Moz also offers Moz Local, which can help you manage your presence in local search.
If you rely on Google, Yelp, or Facebook reviews to bring in customers, this tool can come in handy by keeping track of your reputation and making sure that all your listings are accurate.
SEMrush
As part of its Content Marketing tool, SEMrush has an SEO Content Template, which analyzes the best performing results for your keywords to recommend how to create content around them.
As I writer myself, I found this super interesting.
It recommends semantic keywords to help bolster your writing, as well as the most important backlinks to get. It even tells you the ideal length of a post.
Image via SEMrush
If you’re looking to make content that really pops in search, this could be a great tool that saves you some time.
The Real-Time Content check will even make recommendations on your drafts.
Cool!
Spyfu
A cool and unique tool that Spyfu offers is their Google Ad Advisor, which recommends keywords for PPC campaigns and even tells you whether they’re a “great buy” or not.
Image via Spyfu
I really like this feature because it makes evaluating a keyword’s worth in advertising super simple. You also also see who your competitors would be.
This includes insight into their budgets and how much they’re spending on specific keywords.
Ahrefs
Content Explorer is a tool that goes deep to help you determine a topic’s popularity over time and reverse-engineer your competitors’ content strategies.
If you’re trying to find the most prolific authors in your topic to help grow your backlink profile, they conveniently show them on the overview page, and you can click through to see the top 100.
Image via Ahrefs
When you do this, you can see the authors’ total pages, websites, traffic, and traffic value. Being able to assess the traffic value is important for determining how valuable the author’s content is, and whether it’s worth your time forging a connection.
Image via Ahrefs
Back on the overview page, you can instantly see which are the most valuable pages in the topic.
Image via Ahrefs
And, when you click the details dropdown, you can go really deep and see the article’s performance over time with organic traffic, referring domains, backlinks, and organic keywords.
Image via Ahrefs
Overall, this is a really interesting and helpful tool to help SEOs create better content and keep an eye on the competition.
Support
Let’s take a look at the type of support you should expect from using these tools.
Moz
When you sign up, you have the option to book a 1-on-1 walkthrough with an expert. If you’re new to SEO, this is a good place to start.
Image via Moz
Once you’re up and running, the best way to get help is through their extensive resources, including guides, a help hub, and seminars.
There’s also a community forum where you can ask questions, and other community members or Moz team members can respond.
Image via Moz
If these don’t work, you can also contact Moz by email.
SEMrush
SEMrush has a chatbot that you can use to ask questions and be provided with helpful articles. You can also use the chat window to live chat with a support member.
Image via SEMrush
This is great for getting the answers you need quickly, especially if the articles don’t answer your question sufficiently.
If it’s not a pressing matter, you can leave them a message to get back to you.
In addition to the chatbot, SEMrush also has a help center with manuals, how-to’s, and videos. You can watch webinars from experts on how to use the tool, and there’s also SEMrush Academy, with lessons and quizzes towards becoming officially certified in using SEMrush.
Image via SEMrush
Spyfu
Spyfu also has a support chat where you can choose to speak to someone in support or look up articles to answer your questions.
Image via Spyfu
These articles also live in their searchable Help Center.
Image via Spyfu
You can also learn more with their video tutorials and glossary. However, their resources aren’t as extensive as that offered by SEMrush and don’t include a community forum like Moz.
Ahrefs
Like Spyfu and SEMrush, Ahrefs has a chat feature to help you access their help center, live chat, or their Ahrefs Academy.
Image via Ahrefs
Ahrefs Academy is similar to SEMrush’s Academy in that it provides a curriculum with videos and quizzes to help you become an Ahrefs master.
Something that I found useful while using Ahrefs was their “How to use” buttons within their tools, which provide helpful articles to help you understand what you’re looking at and how to use them.
Image via Ahrefs
You don’t have to navigate away to a different page—it just pops up on top of whatever you’re working on.
Pricing and Value
Now, let’s examine the pricing tiers for these SEO tools, including add-ons.
But, before we get into the details of the features for each tool, here’s a quick comparison of the lowest tier buy-in, as well as the free options and the people that these tools are ideal for.
Moz
Moz offers four different pricing tiers—Standard, Medium, Large, and Premium, starting at $99 and going up to $599.
You can see the features offered at each tier here.
In addition, there is Moz Local, which helps you manage your presence in local search. It comes in 3 tiers:
Lite: $129/year
Preferred: $179/year
Elite: $299/year
If you want to try the tool for free, they offer a 30 day trial.
You can also sign up for a free Moz Community account, which gives you free, but limited, use of these tools, which is the gold standard in free SEO tools.
However, considering what you get in the paid version in comparison to these other tools—particularly Ahrefs and SEMrush—it’s not great value.
SEMrush
SEMrush has three pricing tiers, which start at $119.95 and go up to $449.95. And you can pay extra for different add-ons.
There isn’t a free trial, but there is a free version that gives you 10 reports a day. While it is rather limited, if you’re working on a small project, the scope of data included in those reports is great.
Spyfu
Spyfu plans start at $39/mo and go up to $299/mo. Here are the tiers and features:
Spyfu is nice to use, but it has some significant limitations if you’re an SEO.
For example, when it comes to backlink research, Spyfu only looks at links in the top 50 results, so you can’t get a total view of your backlink profile.
Spyfu also doesn’t offer any kind of SEO audit, which is a big deal if you’re trying to optimize your site for search.
For what it does do, though, it does it well.
Spyfu has a generous 30-day free trial.
Ahrefs
Ahref’s monthly plans start at $99 and go up to $999. Here are the different tiers and features:
As you can see, it’s long and extensive. Ahrefs has the most capabilities of all the tools I reviewed, so it’s the best value.
The lowest tier costs $20 less than SEMrush and includes similar capabilities.
There isn’t a free version or trial, however—a 7-day trial costs $7.
Conclusion
After trying all of these tools, I’d have to say I prefer Ahrefs or SEMrush.
To pick a top one, that would have to depend on your specific needs, as they both have a ton to offer and are generally easy to use.
If you’re a content marketer, I would go with Ahrefs. But, if you’re an advertiser, I’d go with SEMrush.
I particularly liked Spyfu’s UI, even though it included fewer features than Ahrefs or SEMrush.
Moz’s free tools are great, especially if you’re a beginner or working on a single project.
If I had to rank the tools from my favorite to least favorite, I’d have to say:
Ahrefs
SEMrush
Spyfu
Moz
But then again, everyone has their preferences.
I hope you’ve enjoyed reading my review, and that maybe I’ve helped you make up your own mind.
We analyzed 7 leading downhill ski brands for their Search Engine Visibility (SEV) within the “all mountain” ski category. We looked at these brands’ performance in SERPs across 20 non-branded keywords that receive a total of over 355,000 searches each month. We also segmented the keyword brand performance by Search Intent, which sorts out who is doing a better job with PR vs. Ecommerce.
Finally, we analyzed the domains themselves and found that just a few sites were driving the majority of the influence across the SERP.
Ready? Let’s dive in.
Here you can see the keywords analyzed and how we bucketed them by Search Intent. Of the 20 keywords identifies, 9 were transactional (click-to-buy) and 11 were informational (click-to-learn).
This was a deliberately even(ish) mix of informational vs. transactional in order to equitably measure brand performance at both ends of the customer journey.
BTW, if you were wondering, it’s no surprise that the transactional keywords drive significantly more volume than the informational. This is partly due to the fact that these keywords are shorter in length and more generalized in breadth.
While we don’t have click-through-rate information available, I would venture to guess that the CTR of the high-volume keywords like “ski” is significantly lower than informational keywords like “best carving skis 2020.” In fact, if you were to exclude “ski” from the transactional list, you’d see an 85% decrease (300K) in transactional search volume.
Just food for thought.
Now that we have our ski keywords identified and segmented by Search Intent, we can identify the brands we’ll be comparing in our analysis:
Armada
Atomic
Blizzard
K2
Nordica
Rossignol
Salomon
Our goal is to analyze each of these brands’ Search Engine Visibility—a key performance indicator for measuring a brand’s health and customer reach in search.
Search Engine Visibility, or what we commonly refer to as the “Visably Score,” is an analysis of a brand’s likelihood of receiving attention within the SERP. At Visably we base it on Click-Through-Rate, rather than Share-of-Voice (total number of brand mentions), as the entire point of having a brand mention is only valuable, if in fact, people actually see it.
From the 20 keywords analyzed, Rossignol was the top performing brand in terms of total share-of-voice and search engine visibility with their brand name showing up in 84% of organic results and with a dominant Visably Score of 88 (which means, almost anywhere you click, you’re gonna find Rossi skis).
Share-of-Voice
Visably Score
Rossignol
84%
88
Salomon
82%
86
Blizzard
77%
85
Nordica
77%
81
K2
74%
82
Atomic
66%
73
Armada
60%
61
While, for the most part, these brands’ Visably Scores are generally correlated with their share-of-voice, that’s not the case for all of them.
Take Nordica and K2 for example. Nordica actually had more overall mentions on the first page of search, but had the same Visably Score as K2.
Why? Because although K2 had less overall mentions, the mentions they had were better positioned on the SERP. In other words, K2’s organic brand positions receive move clicks and customer engagement than Nordica.
This is a great illustration of why share-of-voice is not a great performance indicator. The true indicator is your content’s position on the page relative to customer click-through-rates.
An Industry With a Small Amount of Dominant Publishers, Merchants, and Manufacturers.
Across the 20 SERPs, there were 198 organic search results in total. However, we found that only 27% of these results included unique root domains. In other words there were only 52 unique websites among the 198 results.
What this means is that the universe of outlets that talk about or sell skis is relatively small. It’s also not a super crowded landscape of brand options… unlike footwear or apparel, there is a high-cost of entry when it comes to ski manufacturing. Which basically translates to a strong likelihood that you’re going to see the same brands over and over again on just a handful of sites. Still, as our analysis pointed out, there are points to be scored for being the most ubiquitous brand out there.
It’s also worth noting that a few outlets accounted for a large share of the search results. Just 5 domains accounted for 38% of all search results (75 out of 198). Evo.com (22), Skimag.com (18), Skiessentials.com (13), REI.com (13), and Powder7.com (9) had outsized representation within the SERPs.
An URL audit like this can be a useful marketing exercise to inform where to focus your PR efforts and how to better merchandise your brand within partner Ecommerce websites.
How did we do this?
Not rocket science friends — just plug in your keyword and brand into Visably’s free SERP Analysis Tool, and extract the results as a spreadsheet.
Repeat it for as many keywords you want to cross analyze by brand. When we release our PRO platform (coming Jan 2021), you’ll be able to do this for dozens, hundreds, or even thousands of keywords simultaneously.
Brand SEV Performance by Keyword
The number in parentheses next to the keyword on the left represents how many total organic results were present within the SERP. The numbers noted in the bar graph to the right indicate how many of the available first-page results the corresponding brand was represented within
What are the takeaways here?
Rossignol wins this month’s “Top Dog of Search” award for best Search Engine Visibility. Congrats on executing a top-performing multi-channel marketing strategy!
Quantity does not mean more clicks. Better brand positions within the SERP mean more clicks. Fun Fact: the top 5 search positions on the page receive over 70% of all the customer traffic for the entire keyword. Conversely, the bottom link on the first page accounts for just 1-2% of all the traffic for a keyword!
Congrats Rossignol for a hard-fought Top Dog in Search Award!!!
One of the first things I do when on-boarding a new client (or employee) is go through the exercise of building-out a keyword and media list.
Google surfaces most relevant content for any subject in the world; mapping the customer journey through keywords and then mining the results to build a media list is an amazing way to wrap your head around the most important outlets and writers for any category.
So how do you do it?
How to Build a Media List Using Google Search:
Identify keywords that are relevant to your product
Run a SERP Analysis of your keywords using Visably
Export your brand results via Visably’s .CSV export
Merge lists into a single spreadsheet
Backfill writer’s names + emails
Get at it!
STEP 1
Identify a list of non-branded keywords
Non-branded keywords are search queries that describe a product or service, but don’t include specific brand language. For instance, “Best Running Shoes” (non-branded) vs. “Nike Running Shoes” (branded). You’re not going to find many useful media results within branded keyword searches and furthermore you want to focus on customers that are brand agnostic, rather than brand loyal.
As you build the keyword list, reverse-engineer how a customer might find or discover your product within search. Think about questions your customer might ask or queries that refer to pain points, desired features / benefits, or comparison language.
For example, if you’re a company that sells headlamps, you may zero-in on keywords like these:
Best rechargeable headlamp
Camping headlamp review
No-bounce headlamp
Best performance headlamp
Night hiking tips
What is the most powerful headlamp for hunting?
What is the best headlamp for spelunking?
Useful tips: How to generate keyword ideas There are several tools to help you can mine additional ideas around which keywords to focus. Google itself provides keyword hints within Google Auto-Complete, and search results like “People Also Ask,” and “Searches related to…”
There are also several free keyword suggestion tools we recommend:
Run a SERP Analysis of your keywords using Visably
Once you have established a short list of the most relevant keywords, you’ll want to run a SERP analysis using Visably to identify which of these keywords lean toward “Informational” in Search Engine Intent — that is, keywords with majority “Click to Learn” style content (as opposed to ecommerce or ‘Click to Buy’).
By focusing on keywords of “Informational” intent, you’re more likely to scoop up media results, reviews, and relevant publisher / blog content to add to your media list. It’s also okay if the intent is mixed 50/50 (Informational & Transactional) — you can use Visably’s Channel Identification Technology to filter out all the non-media results later.
Visably PRO (coming soon) will allow you to do this kind of analysis in batches. However, with the free SERP Analysis Tool, you’ll need to collect this data one keyword at a time. While you’re doing this, Following each search be sure to “export the results” to CSV…
STEP 3
Export Results to CSV
At the bottom right of the SERP analysis, click the “Export CSV” button. A CSV file will automatically download to your computer, and you will receive a table like this:
Repeat the export process for all of the “Informational” SERPs you’ve identified.
STEP 4
Compile and Sort Results
Now it’s time to compile the data by merging the CSV exports together into a larger spreadsheet. Sort the spreadsheet by the CHANNEL column, select all the “informational” or “earned media” results and delete the rest.
STEP 5
Backfill Writer’s Names and Contact Information
Next, find and add the authors’ names and emails and add to the list. You can often grab these from the bylines within the search results, or author bio’s at the bottom of the page. If you have access to a PR database solution, this is a great time to use it. Otherwise, LinkedIn and good old-fashioned Google searching can get you a long way!
Example Media List pulled from “Best Headlamp” Search Results:
What’s lovely about this process:
Google does the hard work of finding all the world’s most relevant content within any category for you. Maybe you don’t agree with Google’s selection of sites? Well, sorry, but even if you don’t agree with Google, these writers’ work is being rewarded with thousands of high-quality customers / readers day in and day out as a consequence of their top search position.
Visably does the hard work of exporting and sorting the earned media results from everything else.
No Spamming. You’re only getting publishers and writers that are considered the top authorities on a subject.
Using this list will improve the likelihood that your PR will show up at the top of search. By focusing on outlets that have a good track record with Google’s algorithms, you’re setting yourself up for search engine success.
Although time-consuming, this list-build strategy provides a straightforward, ROI-focused, and nearly limitless roadmap (depending on how many keywords you choose to audit for media results) for any PR project.
With warm weather on the decline (at least here in Wyoming), we’re making the most of evenings spent grilling in the backyard with family and friends (all appropriately distanced, of course).
As such, this week we’re taking a deeper look at how grill brands compete for visibility in search. We’re also introducing — for the first time — a new accolade to properly recognize the top performing brand within the category, or as we’re calling it: the “Top Dog in Search” award 🐕 .
Search Engine Visibility: Gas Grills
We analyzed 5 leading grill brands for their Search Engine Visibility (SEV) within the gas grill category. We focused on 41 non-branded keywords that are used over 159,000 times a month by customers looking to research or purchase a gas grill. We also segmented the keywords and brand performance by Search Intent.
Branded vs Non-Branded Keywords
Search keywords that don’t include a specific brand-name are considered ‘non-branded.’ For example: “Nike running shoes” is a branded keyword phrase, while just “running shoes” with no company name present is considered non-branded. People who search for non-branded keywords are brand agnostic at the moment of search, or at least indicate a willingness to consider multiple options that meet their search criteria.
Below you can see how we bucketed the keywords by Search Intent (for more depth on what Search Intent is and how Visably measures it, read our blog here). It’s important to recognize that SERPs are almost always a spectrum of informational and transactional page results. Visably uses A.I.-assisted technology to identify the intent of each result in the SERP and then makes a determination if the keyword results are attracting more transactional (click-to-buy) or informational (click-to-learn) content.
As you can see, transactional keywords had 126.6K more monthly search traffic than the informational keywords—that’s 766% more traffic. It’s not surprising to see transactional keywords receiving such high volume traffic and also higher overall SEO competition. For individual brand SEO, these keywords almost entirely out-of-play (due to the competitiveness of the terms). Yet, an SEV strategy that focuses on transactional keywords has benefits that will be evident below.
Now that we have our grill keywords identified and bucketed by Search Intent, it’s time to identify the brands we’ll be comparing today:
Blaze
Char Broil
Dyna-Glo
Napoleon
Weber
Once again, our objective to examine how these brands are doing with their Search Engine Visibility (SEV), what we consider to be the most important success metric when it comes to a successful search engine strategy.
What is Search Engine Visibility (SEV)?
Search Engine Visibility or SEV is the statistical likelihood that a specific brand or product will be “discovered” by a customer within the SERP. SEV is different from SEO in that it takes into account ALL the potential customer touch-points within the SERP and measures how likely a searcher is to find a brand among all the results.
Search Engine Visibility is predicated upon the idea that it doesn’t matter how a customer discovers a brand, so long as they do in fact discover it. This places a premium on SERP position and an agnostic position on the actual type of touch-point (e.g. brand-owned content vs. PR vs. ecommerce).
Important considerations when calculating SEV:
Every result in the SERP has a unique clickthrough rate dependent on its position and feature type.
The top 5 organic links account for upwards of 70% of the total traffic for any keyword. Being included in any one of the top 5 spots can be many times more valuable than multiple brand positions in the bottom 5 results.
Special SERP features need special consideration. These features can be much more valuable than their click-through-rate imply. Special features like a ‘Featured Snippet’ are designed to provide “no-click” answers and are given preferential visibility within the SERP.
As you can see from the 41 keywords reviewed, Weber pulled both the most overall share-of-voice (65.73%) AND the strongest positioning within the SERP with an average Visably Score of 60.3. Frankly, it’s hard NOT to find Weber among these results.
But after Weber, it gets more complicated. To understand why, it’s important to recognize that share-of-voice (the absolute number of mentions) is NOT equal to a brand’s search engine visibility.
Just look at Char-Broil. Although well-represented within the overall SERP (ranking second to Weber), Char-Broil has lower positioning within the SERP than Dyna-Glo and Napoleon, who both had less total brand mentions, but higher average Visably Scores. (Char-Broil’s is 31.1 while Napoleon and Dyna-Glo averaged 35.2 and 32.8, respectively.)
What is a Visably Score?
Visably Score uses a proprietary algorithm to assess the likelihood of a customer discovering the brand within the SERP—e.g. the measurement of a brand’s Search Engine Visibility. We take into account both the results’ position within the SERP as well as the feature type (an organic result vs. featured snippet, etc.).
For example: a brand with a 0 Visably Score has a 0% chance of being found within the SERP, while a brand with a Visably Score of 100 will be found in every identifiable nook and cranny within the SERP. A Visably Score of 70 or higher is considered a very strong brand position, however, just getting on the board (with any score) is good.
Informational vs. Transactional Search Performance
The results start to get really interesting when you look at informational vs transactional search performance.
You can see that while Napoleon ranks last in share-of-voice among informational searches (21.84%), Napoleon makes up the gap in search visibility among transactional searches. Napoleon in particular should be commended on its excellent online sales merchandising that has resulted in very strong positioning within transactional results.
Keep in mind that those transactional searches reached 766% more people than the informational searches we identified AND they draw upon customers who are further down the sales funnel.
How did we do this?
Easy—just plug your keywords and brands into Visably, and let us do the work. If you’re wondering how we did multiple batches, well, you’ll just have to wait until we release Visably PRO (coming later this fall).
Brand SEV Performance by Keyword
Here we broke down search engine visibility by keyword. The number in parentheses next to the keyword on the left represents how many total organic results were present within the SERP. The numbers noted in the bar graph to the right indicate how many of the available first-page results the corresponding brand was represented within.
What are the take-aways here?
Weber wins this week’s “Top Dog in Search” award for best search engine visibility! Kudos on a dominate multi-channel search strategy!
Leveraging multi-channel opportunities won big dividend for brands like Weber and Napoleon to increase their visibility in searches where their brand-owned content wasn’t able to rank.
Brands that work well with ecommerce partners win brand visibility among high-volume transactional results that rake in customers who are “ready to buy” and demonstrably not (yet) brand loyal.
A greater share-of-voice in the SERP does NOT correlate to a greater chance of customer discovery
Congratulations to Weber for executing an outstanding multi-channel search strategy!
Being based in Jackson Hole, WY, we see our fair share of fleece jackets. Jackson locals know there’s always a good story behind well-worn jackets held together by duct tape or homemade patches.
For the fun of it, we decided to analyze 6 leading outdoor brands for their Search Engine Visibility (SEV) within this category (fleece jackets). We selected 20 non-branded keywords of commercial intent that related to fleece jacket product discovery and controlled for the following criteria:
Specific Monthly Volume
Difficulty / Competitiveness
Organic Click-Through-Rate
Search Engine Intent
Q: What’s a non-branded keyword of commercial intent?
Search queries that don’t include a specific brand-name. Ostensibly, people who type in non-branded keywords are brand agnostic at the moment of search, or at least indicate a willingness to consider different options that meet their search criteria.
Furthermore, we bucketed the keywords by search engine intent — meaning, how did the search engine interpret the intent behind what a searcher is looking for? If the organic results were more than 50% transactional (click-to-buy) we identified the keyword as “transactional.” Same for informational (click-to-learn).
Once we had our keywords identified and bucketed by search intent, we used Visably to cross-analyze each SERP for the following outdoor brands:
Columbia
The North Face
Patagonia
Mountain Hardware
Marmot
Arc’teryx
We were primarily interested in how these brands were doing with their Search Engine Visibility (SEV): the statistical likelihood that any single brand would be “discovered” organically within the SERP.
(not to be confused with SEO – at Visably, we look at all the potential touch-points within the SERP and measure how likely a customer is to find a brand among the PR results, ecommerce pages, brand-owned media, etc.)
As you can see, across all 20 of the keyword searches that we analyzed, The North Face won nearly 71% share-of-voice across all organic search results, followed closely by Patagonia (69%) and Columbia (62%).
However, perhaps more interesting is how these brands began to differentiate when it came to transactional vs. informational search intent. Although we surveyed only 6 transactional keywords, Columbia was by far the leading brand when it came to dominating ecommerce landing pages (and first-page success with its own SEO). Almost completely missing from these pages was Mountain Hardwear at just 4% share-of-voice.
For informational searches (e.g. public relations acquired media reviews), Patagonia rose to the top of the field with an impressive 81% share-of-voice, followed by The North Face at 79%.
How did we do this?
Simply use Visably to cross-analyze any SERP for any branded content:
What are the take-aways here?
Find your blinds spots and fix’em.
Brands like Patagonia and Arc’teryx are likely to be more selective with their online ecommerce partners and may not sell through many of the ecommerce sites that show up in transactional searches (like Macys.com).
However, if they do sell fleece jackets to one of those vendors and they’re not being merchandised on their search engine landing page, now they at least have that intelligence and can have a conversation about specific search landing page merchandising with those vendors.
For brands like Mountain Hardware and Marmot, there’s a clear opportunity to identify blindspots within their PR strategies and use Google Search to identify the most relevant writers and outlets within these categories.
Fortunately Visably identifies the PR hits for you, meaning that you can simply export the results and isolate the PR hits for list-building and future outreach purposes.
Brand SEV performance by keyword
n.b. The number in parentheses next to the keyword on the left represents how many total organic results were present within the SERP. The numbers noted in the bar graph to the right indicate how many of the available first-page results the corresponding brand was represented within.
Every online search tells a story, weaving together a dynamic picture of why a search query was submitted.
Search engine intent is a metric that reveals what’s truly going on in search engine results pages (SERPs). And it’s exactly what marketers, advertisers and brand managers need to understand to fully grasp their online reach, their prospects’ queries and their future keyword targets.
What is search engine intent?
Search engine intent is how a search engine like Google, Bing or DuckDuckGo interprets the intent of a search query. Basically, the search engine has to deduce the primary reason behind why the person submitted the query.
The reason Google has become the world’s search engine of choice is because it is very good at providing people with the answers they’re looking for. Take, for example, something as seemingly straightforward as “Shoe Trends 2020.”
What exactly is this searcher getting at? How can Google deliver the best user experience on the first try — and in real time?
There are numerous potential reasons behind “Shoes Trends”:
A Gen Z blogger wanting to stay on top of the latest fashions.
A parent looking to quickly make a purchase.
A shoe designer doing some online competitor research.
Search engines (Google in particular) have become quite good at sniffing out what a searcher has in mind when they enter a keyword query.
Transactional vs Informational
vs Navigational Intent
When you drill down into “intent” proper, you can distinguish between the most common types:
Transactional intent: These searchers want to make a purchase. They “Click to Buy.”
Informational intent: These searchers want to gather information. They “Click to Learn.”
Navigational intent: These searchers want to navigate to a specific site or webpage. They “Click to Go.”
So, someone who searches for “running shoes” and clicks on an ecommerce site is further down the sales funnel and more inclined to make a purchase in the near future; they’re transactional.
Alternatively, someone who searches “number of countries in the world” is purely just looking for information, whether that’s from a featured snippet, Wikipedia or a high-authority domain. (According to the United Nations, the answer is 195 by the way.)
Lastly, someone who types “Content Marketing Institute” into Google is looking for one thing: to be directed to the Content Marketing Institute’s website. They know where they want to go but may not search for a full URL, instead using a search engine to navigate them to where they intend to be.
By understanding search engine intent, not only do you know how keywords are showing up in SERPs but also with which type of intent you can build content around. This especially applies to transactional (Click-to-Buy) and informational (Click-to-Learn) intent, as these are inherently more important to marketers and brand managers because they deliver qualified customers.
People submitting non-branded (non-navigational) keywords that are marked as transactional or informational, are your clutch customer. They’re either ready to make a purchase (and haven’t decided what brand they’re going to buy) or they’re still collecting research. Some SEOs will call this “Commercial Investigation,” but at Visably we consider it the same as “Informational” (Click-to-Learn).
Because navigational intent is often incredibly clear, there’s not much analysis required on your part. You can, for the most part, filter this out of your research, as navigational queries are heavily branded and these users may be repeat customers or those already familiar with your brand. All of this is good news, of course, but you don’t necessarily need to create new content or rework your SERP strategy for navigational searchers — not starting out, at least.
Keyword research using search engine intent.
Search engine intent qualifies SERPs. By this we mean that by uncovering the intent inherent in SERPs, brands can pinpoint their customers’ wants, needs and desires using Google to do the heavy lifting.
This is an incredibly powerful realization that serves a range of purposes, in particular in the realm of keyword research.
Conventional keyword research begins with a general brainstorming session, proceeds to research within an SEO tool of your choice and then results in a lot of data exporting and spreadsheeting. Hopefully by the end of this process you’ve got a list of keywords that are relevant to your brand and its goals.
But not so fast.
These keyword lists are fine and you may get lucky matching up SEO content strategy with search intent. But why spend all that time and content investment without knowing the critical piece that is going to make a SERP flush with commerce-oriented results vs. informational blogs and reviews?
Even if marketers have intent in mind, they likely rely on a basic formula to decipher search engine intent: keyword descriptors + SERP features = intent.
for example: the descriptor “Cheap” added to “Running Shoes” — along with a cursory glance at the SERP — may suggest that the intent is transactional
It’s a start, but still not as precise as we need it to be. The number of SERP features that appear for any given keyword is limited to what Google decides to show you, which is usually just the top-ranking organic result (i.e. featured snippet / answer box). So, if you’re just going to peek at a featured snippet and deduce search intent solely from that quick glance, you’re skipping out on a better process.
You need a more comprehensive and less time-intensive workflow that automates SERP analysis beyond just SERP features and keywords. To more accurately ascertain search engine intent, look at every result on the SERP — not just the featured snippets.
With a 360-degree view of the SERP in its entirety, intent really comes to life. What is each listing saying? What stories are hidden in these results?
More importantly, how can you target the keyword intent for your gain?
How to think of search engine intent as a metric
Remember, keyword strategy is only half-baked if it’s not:
Intent-driven.
Lucrative to your brand.
Feasible to win page-1 visibility.
This is not to say that traditional keyword metrics are garbage; it’s all critical information that plays into how you form search strategy. The fact is, as Google evolves its algorithms, digital marketing tools need to keep up.
So what you really need aren’t keyword lists per se, but additional keyword-scoring and qualification mechanisms. You need to know priority keyword targets, audience personas, channel segments and more. Oh, and this is, of course, on top of some of your mainstream metrics like keyword difficulty and search volume.
Even further, cost-per-click, competition scores, page authority and other metrics can be helpful only to a degree. They contribute good data to your cause but only one part of the modern dimension needed.
For instance, you could use all the above metrics to identify THE perfect keyword + strategy, but what if it turns out you’re actually not targeting the right intent? If all of the current listings in SERPs for your keyword are informational intent but you actually write content that’s transactional, you missed the point entirely.
Search engine intent needs to be a primary metric across all of your keywords, to ensure you’re optimizing your brand to compete on the correct playing field.
And that’s exactly what Google and other search engines get better at every day. With algorithm updates large and small made daily, a search engine can recognize the context of a page beyond just keyword matching and a URL. It understands intent and works to serve the correct intent to users with every query. To play Google’s game, intent matters.
Package together all of this keyword info not just for your SEO and inbound marketing teams but for your public relations, ecommerce, paid advertisement and social media teams as well.
After all, conducting business online means there are trillions of customer touchpoints across every channel. “Keywords” are really just the digital identifiers of those touchpoints: the who, what, where, when, how.
As you dive into keyword research, take a step back and analyze SERPs through every lens possible because virtually every channel now lives on SERPs.
Google serves much, much more than 10 blue hyperlinks. It hosts a trove of prospect data and business intelligence vital to your brand visibility and aspirations.
A blueprint for every channel
Putting a SERP to work for you isn’t all that difficult if you know what to look for.
Within each SERP you’ll see all types of links and content — not just organic results like company blogs or product landing pages. However, for the purposes of marketers, we bucket organic results in three predominant categories:
Ecommerce
Earned Media
Brand-Owned
Ecommerce
While ecommerce typically refers to any type of sale conducted electronically, that’s not a particularly useful definition if you’re a marketer wanting to assess the search landscape.
We segment ecommerce a little differently. Any platform that sells another brand’s products on its platform is ecommerce, like Amazon (but not the Amazon Choice products). eBay, Wayfair or Facebook Marketplace would be considered ecommerce.
These platforms represent huge — and growing — opportunities for your brand to appear in SERPs and across the web, making them a chief factor in keyword research and keyword strategy. That’s why Amazon SEO is now its own subgenre of SEO techniques.
As you can imagine, ecommerce intent is very commercial in nature, and users are looking to purchase products with just a few clicks.
Earned Media
Third-party publications, independent networks or other organizations that link back to or feature your content are considered to be “earned.” In other words, you didn’t pay for it, but you benefit from it nonetheless.
These editorials, reviews, features and guest spots add credibility to your brand, improve your reach across the web and accrue backlinks to your site. So while your company URL might not appear in SERPs in this case, it is still linked to and identified in the content of those that do rank in SERPs.
This collateral benefit brings high-intent traffic to your brand, and it’s often a blind spot for most SEOs. Comb through not just URLs in SERPs but the actual content within each of those links to find keyword matches and brand-relevant information you can use.
Brand-Owned
Company blogs, social media profiles and other brand-controlled media properties comprise, in many cases, the bulk of listings that appear on SERPs. Because keyword rankings are often correlated with longer-form content, writing in-depth guides, how-tos and product features is a great way to elevate your brand in SERPs and control every part of the process, instead of relying on third parties or fluctuating ad spend.
In the image below, you can see how Visably captures, dissects and visualizes SERPs by intent — overlaid with the above channels — so you can quickly glimpse what’s really on the table when doing keyword research and planning future campaigns.
Add all of this up and what do you have?
The ability to isolate channels within SERPs, provide actionable steps to your internal teams or vendors, define customer touchpoints and build campaigns around true search intent. Really, you make search intent measurable and functional.
Visably identities the core purpose of a site or webpage and buckets them by channel. This provides for easy list-building, more strategic review and a roadmap for your PR and Ecommerce teams.
How Visably Determines Search Engine Intent.
As stated above, at Visably we think within three core types of search intent:
Transactional intent / Click-to-Buy
Informational intent / Click-to-Learn
Navigational intent / Click-to-Go
We also said that Navigation intent isn’t of huge importance to strategy (just make sure Google can crawl your site and you’re good).
Visably developed Channel Recognition Technology that uses AI to bucket websites based on the core function they serve.
> Is the website owned by a brand that only promotes / sells their own stuff? = Brand-Owned
> Does the website create independent content, editorial analysis, or other unique content as its core purpose? = Earned Media
> Is the website a platform to resell other brands’ products or services? = Ecommerce
In additional to these, we identify 10 other website categories AND sub-categorize Brand-Owned content as either “transactional” or “informational” based on page content.
We then review each organic link in the SERP, categorize, and bucket accordingly.
Earned Media = Informational
Government = Informational
Educational = Informational
Reference = Informational
Internet Tool = Informational
Forum = Informational
Social Media = Informational
Brand-Owned / Informational = Informational
Ecommerce = transactional
Affiliate = transactional
Brand-Owned / transactional = transactional
Brand-Owned = navigational
Political = navigational
Entertainment = navigational
Adult = n/a
We see search engine intent as a spectrum and developed a scale that demonstrates how the aggregate organic results lean:
Sometimes the intent is very clear, other times it’s muddled. But that’s search for you.
More data = more search intelligence
Search engine intent, measured in this way, renders more KPIs, ones that aren’t always present in traditional SEO tools and methods.
Don’t just examine links in SERPs. Dive into all of the content contained within all of those links. Most tools usually use cached systems that scrape information from Google every few days or weeks, meaning your search engine strategies could, by default, be a bit outdated. More modern tools use live data, which is as real-time as it gets.
With more data at your disposal you can uncover unique KPIs like:
Estimated content clicks: How many clicks you can reasonably expect to receive depending on the position in which you rank. This is more precise and practical than a generic “search volume” metric that doesn’t account for no-click searches or SERP distractions like ads, images, videos and featured snippets.
Equivalent ad value: How much you stand to gain monetarily from your keywords relative to what it would take to accomplish the same dollar amount in ad spend.
Brand footprint: How visible and present your brand is online, across all trackable media, including the channels discussed above.
This information adds new dimension and precision to your search marketing, allowing you to invest in keywords and channels that are most likely to reap rewards. Your boss will love to hear you’re efficiently spending every dime without letting anything go to waste.
Optimize EVERYTHING for comprehensive ROI
The final point here is that unlocking search engine intent empowers brands to go full throttle on all campaigns simultaneously.
There’s less “wait and see” or “this channel over another.” Each component of your larger marketing and sales strategy gets the attention and investment it deserves, plus a measurable way to report ROI.
Too often companies drop pay-per-click (PPC) advertising to devote time to inbound marketing. Or they create only top-of-funnel content at the expense of bottom-of-funnel content. And worst of all, they target the wrong intent entirely. It doesn’t necessarily have to be this way, though.
When you can decipher search engine intent, properly analyze SERPs and track channel performance, you can optimize anything and everything. That means going after only the keywords that matter and only the leads that matter on all fronts: paid, earned, ecommerce and owned.
This allows you to connect every search strategy decision to ROI.
And to think, it all started with a keyword.
About the Author: Michael O’Neill is a writer, editor and SEO in Chicago. He’s a runner, reader and hiker too.
I’m the Founder of Visably and I’m glad you’re here. I started Visably in early 2019 because of a simple question I had been asking for years:
How do I measure all the places a brand exists in search?
Marketers have no idea how their brand is being presented in search unless your own website or advertisement happens to show up.
A bit of background on why I was asking that question. I’ve been a marketing communications professional for over 17 years and for the last decade I’ve been operating my own public relations agency. Whatever you think it is that PR people do, it can be summed up as this:
we leverage other peoples’ audiences for our clients’ gain.
PR is all about soliciting third-party endorsements and in-so-doing, accessing the audiences of those third-parties.
The traditional platform to do this has been the publishing industry (magazines, newspapers, etc.), but over the past decade PR has transformed from an industry focused on newspaper clippings to something much more dynamic that encompasses social influencer, content creation, events, and live streaming video (just to name a few).
Personally, I became fascinated by the intersection of PR and SEO after recognizing that our most valuable PR hits were the ones bubbling up to the top of search for competitive keyword searches.
Back then, there was no strategy to it — we would just occasionally recognize that one of our PR placements was crushing it. We’d cross-check some iteration of the keywords present in the URL parameters and sure enough — there it was sitting at the top of search for a high-traffic keyword. A keyword, mind you, that the client could NEVER have ranked for on their own. And yet, there was our work — winning the top of the search podium.
We found that winning PR hits at the top of search was the single most productive thing we could do as a PR agency.
Recognizing the value of PR and search was an epiphany that permanently changed how our agency did PR. Not only were we putting a credible endorsement out on the internet, but we were serving it to EXACTLY the right customers.
At the same time, we saw our clients really struggling to build front-page visibility for their target keywords.
The above graph is real data from a mid-sized brand-owned website trying to rank in organic search for a non-branded keyword over an 18-month period from January 2018 until Sept 2019. Notice how the brand receives quick gains at the beginning, but the brand plateaus once it hits page-2. The net result has zero impact on the brand’s web-traffic.
This is because it’s fundamentally REALLY TOUGH to get your content on the first page of search, especially if you’re an early-lifecycle brand. In these cases, you’re competing again websites of much higher reputation that have spent years building backlinks, monthly visitors, and authority with search engines.
The goal of PR, SEO, or any digital marketing initiative for that matter, is to be seen by your customers. Secondarily, if your communications can be considered as credible and trustworthy, then you’re really crushing it.
Visably measures the likelihood of product discovery within any given search.
To us, it doesn’t matter if a customer finds your brand by reading a PR review, clicking-through on an ecommerce site, reading about your brand on Quora (e.g. People also ask), seeing an ad, or clicking on your own website. Any way the customer’s journey unfolds is perfectly valid, so long as you capture that person within your marketing funnel.
Visably reviews all the organic links on the first page of search AND the link’s page content as well. Essentially, we review what the customers actually see: the content on each linked page within the search results. We do it in real time (so it takes a little longer), but we deliver a suite of interesting KPIs that are unique to anything you’ve seen in SEO.
What Visably Does:
Measure Your Brand Footprint in Search Visably is the first platform to not only review the search result URLs, but also the content within each of those URLs. That means Visably identifies brand hits from PR hits, ecommerce, and more.
Provide Novel KPIs for Brand Search Performance Visably provides traditional keyword data (Monthly Search Volume + CPC) but also some new metrics: Visably Score, Estimated Content Clicks, Equivalent Advertising Value, and SERP Channel Analysis. These new KPIs provide new insight as to how you’re performing within any given keyword AND insight into the intent of the SERP itself.
Intent-Based Keyword Research With Visably’s Channel Recognition Technology, we can identify how the search engine interprets the “intent” of a query as transactional or informational. We map each domain as “Ecommerce,” “Earned Media,” Brand-Owned,” or something else. Ecommerce and Brand-Owned “Click-to-Buy” pages indicate transactional intent, while earned media (blogs, editorial content, etc.) indicate informational intent or “Click-to-Learn” results. These differences inform content strategy for a keyword and invites multi-channel collaboration.
Strategic Alignment Across Teams Align your PR, Ecommerce, SEO, and digital advertising teams toward a singular goal: to improve your brand visibility in search. Visably’s data will help inform when to bid for keywords vs. when to optimize organically. Visably’s channel analysis will also inform which keywords have better opportunities for PR teams, SEO teams or Ecommerce teams. You can also sort and extract channel-specific lists, thanks to Visably’s channel recognition technology.
Real Time Data Visably’s data is pulled in real-time, so you get a true glimpse of what the search landscape looks like right now. For this reason, Visably is slightly slower than other SEO platforms you may be familiar with – our data is identified and delivered in 8-12 seconds, whereas cached searches can be delivered in 2-4 seconds.
“Visably Score” indicates the overall prevalence of your brand or content within the SERP
SEOs and digital marketers need to move the goal line from “how do I improve my website’s search position,” to “how do I improve my BRAND’s search position?”
There are so many ways a customer can find or discover a brand in search — your website is just one of them. You might be surprised at the level of branded content in a SERP already. Your Ecommerce partners may be promoting your product on their search engine landing pages. Your PR team may have secured multiple media reviews or awards that are showing up at the top of search. Or Bloggers may be recommending your product.
But without a direct link back to your website (e.g. an affiliate link to Amazon rather than your site), none of these points of discovery are directly manageable (or trackable) through traditional SEO software. They are, however, valuable customer touch points and worth trying to manage.
And that is the fundamental value of why we want to measure brand visibility in search. I call this Search Engine Visibility because it goes beyond SEO to focusing on all the ways a customer might find your brand, product or service within a SERP.
Search Engine Visibility (SEV)
DEFINITION (noun): The overall “visibility” of a product or brand within a Search Engine Results Page (SERP). All search results, paid and organic, are factored into a brand’s SEV. SEV directly corresponds to the likelihood a customer will discover a brand, product or service while performing a search query.
As a PR team, we recognized that if we could audit a SERP for PR opportunities, then we could zero in on the writers and outlets that Google was rewarding with top search results. We could then either ask a writer to update their posts with our client’s product, or set up a new review for the next time they publish a story.
For Ecommerce teams, were they even aware that their vendors weren’t merchandising their stuff on these super popular search engine landing pages? Turns out no, they had no idea — and they certainly weren’t thinking about inbound traffic through search engines as a way to capture customers.
What if they could audit all their target keywords for which ecommerce sites were including their products on their landing pages and which weren’t — and then use that audit to improve their merchandising efforts?
These were seemingly new conversations. Ones that got me very excited about what a product like Visably could do for people.
Visably’s SERP Channel Analysis examines the “intent” of the keyword results by the search engine.
Search in a whole new light.
Marketing has always been about reaching the customer by any means necessary. It only makes sense to explore all the potential customer touch points within the SERP, rather than just focusing on how your website’s content can do the job.
Recognizing that your keywords hold more potential than monthly search volume or “SEO Competition Score” might reveal is eye-opening. While it may be true that your SEO / Content team may have a very hard time ranking for a highly competitive keyword, your PR or Ecommerce team may just need to pull a few quick levers to build brand visibility on the page.
You just have to know where to look.
Thanks and I hope you find value in Visably. Tell me what you think at Chris@visably.com